May’s map of the month
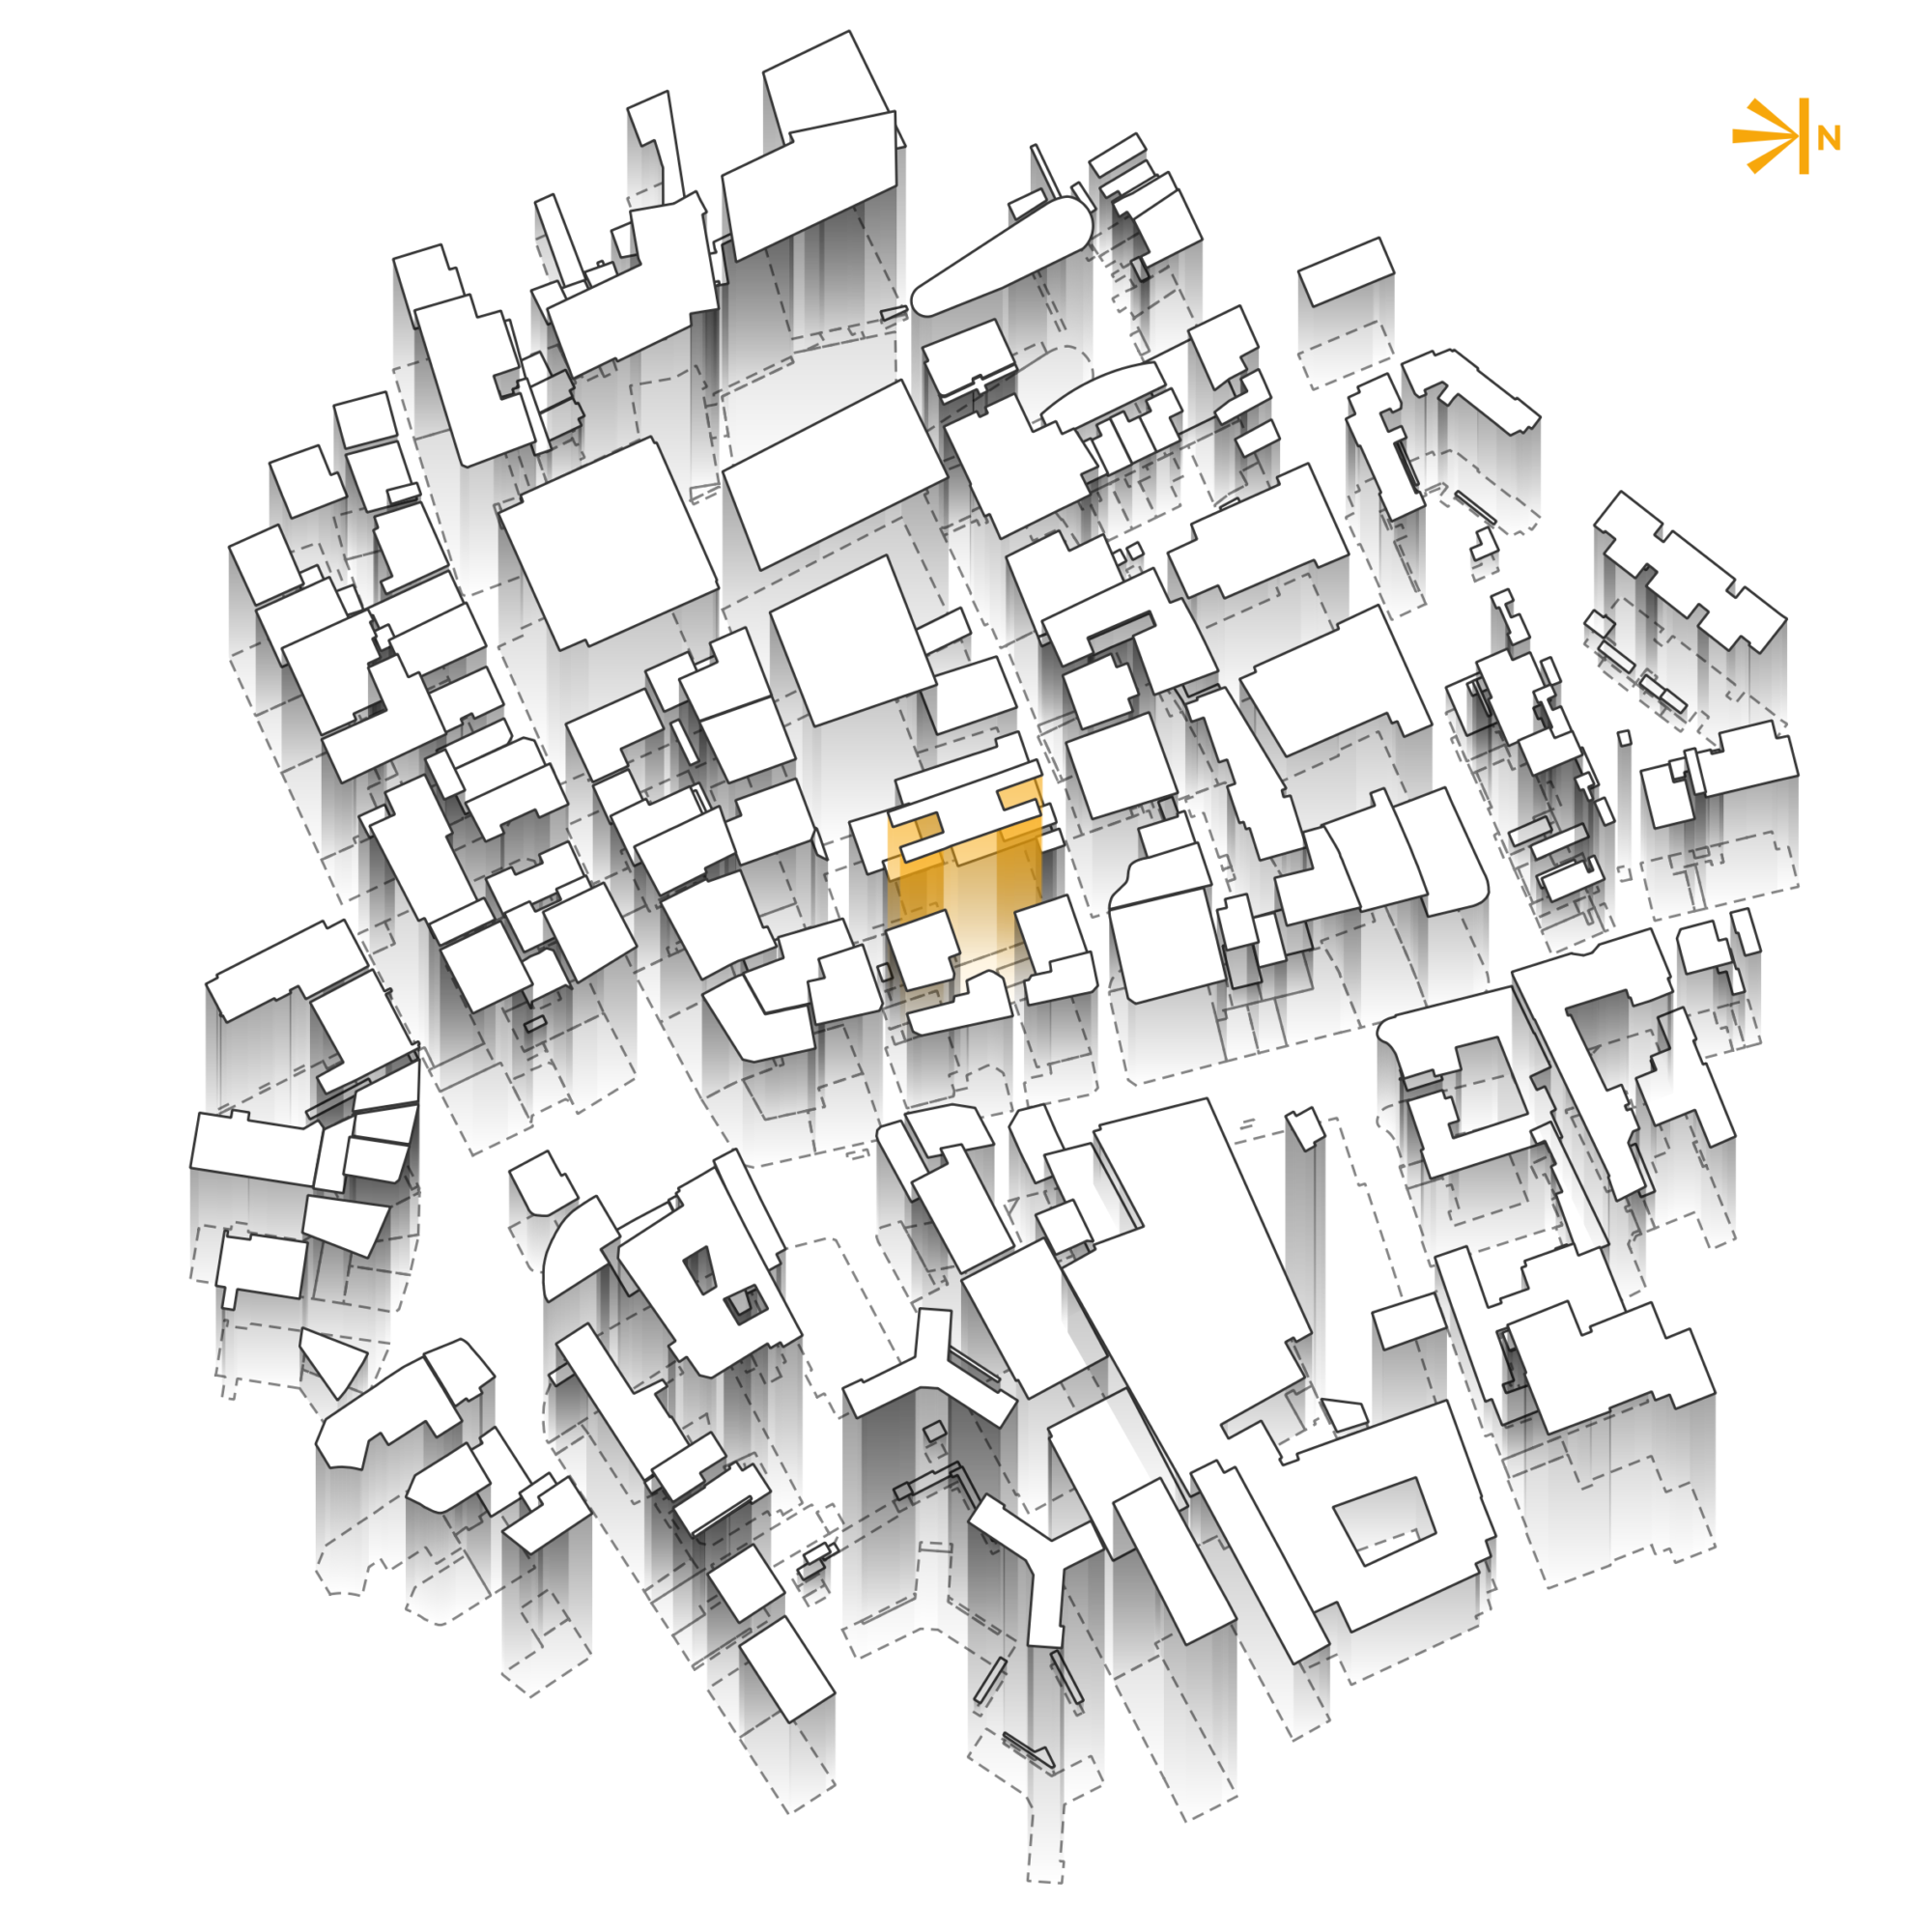
This month the team were challenged to create maps using Geovation branding – they’ve done a great job! Take a look at what they’ve created below.
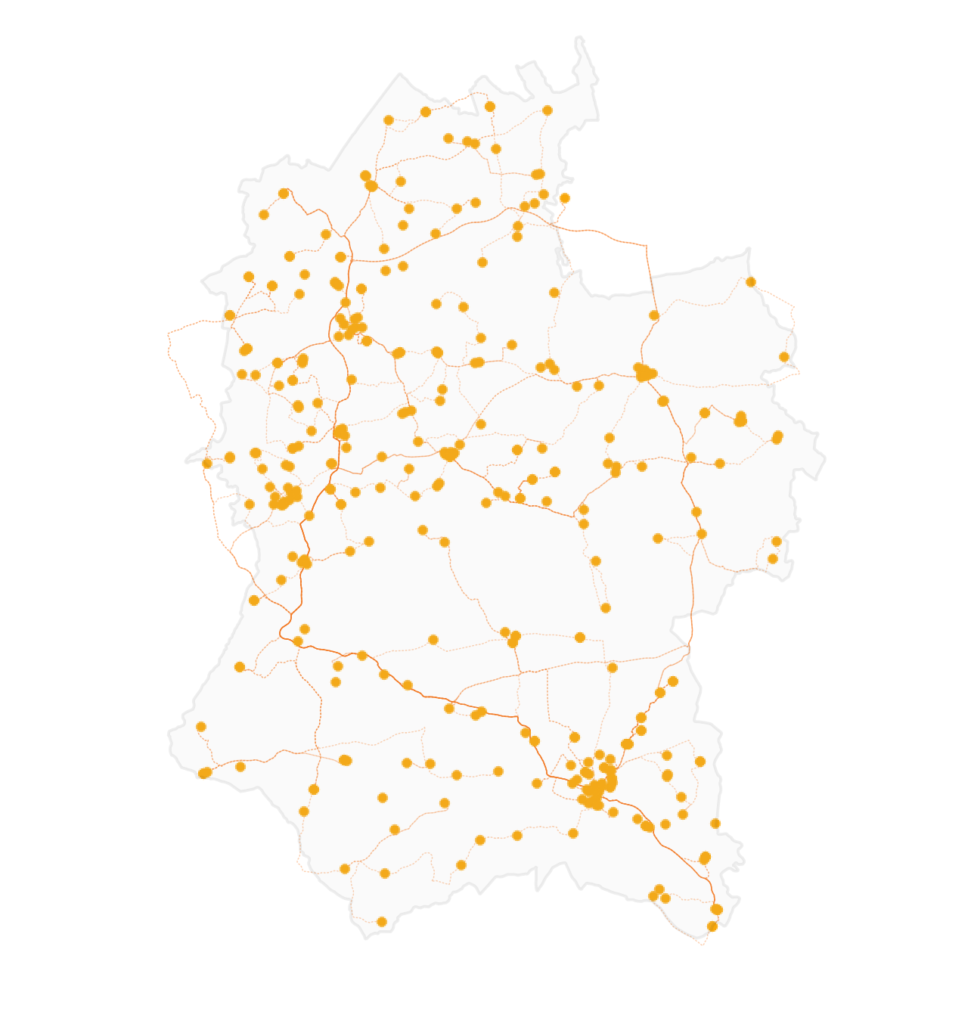
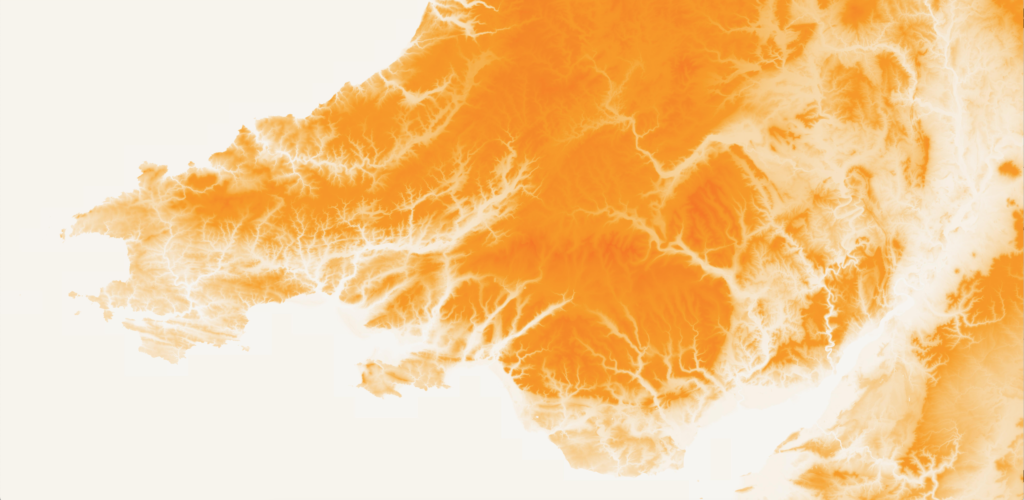
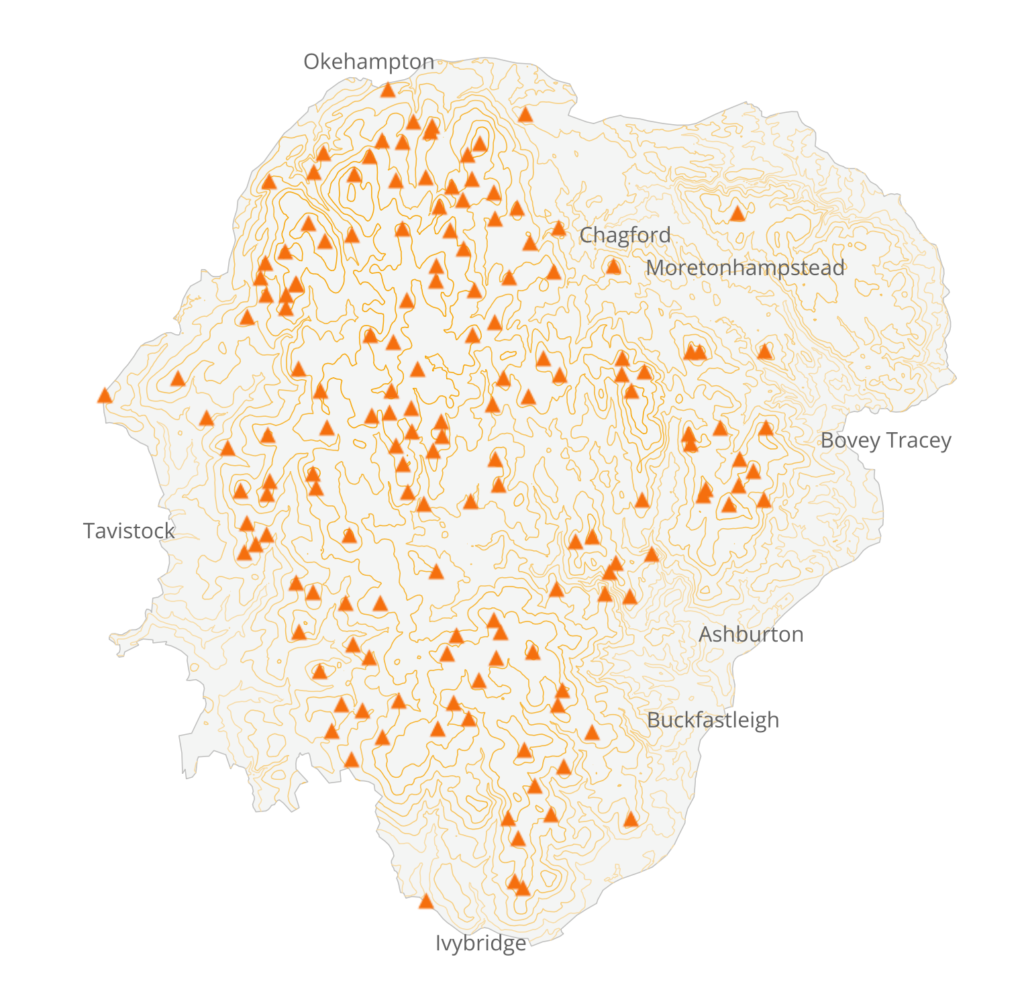

All the maps were created using QGIS using OS data.
Meet the Tech Team here, and find out how they can help you with all things data!